Introduction
Not everyone has an AWS EKS cluster sitting around for learning. The good news — you can run a fully functional CloudNativePG PostgreSQL cluster on your Windows laptop in under 30 minutes, using WSL (Windows Subsystem for Linux) and Kind (Kubernetes IN Docker).
This is the local lab setup that mirrors exactly what you’d run in production. You’ll install a 3-instance PostgreSQL cluster with the CloudNativePG operator, verify it with the cnpg kubectl plugin, and set up a live Grafana dashboard to monitor your cluster — all running inside WSL Ubuntu on Windows.
No cloud account needed. No credit card. Just your laptop.
What you’ll learn:
- How to set up WSL Ubuntu and Docker Desktop for Kubernetes development
- How to create a local Kind cluster and install CloudNativePG
- How to deploy a 3-node PostgreSQL cluster with one YAML file
- How to use the
cnpgkubectl plugin to check cluster status, connect to psql, and run switchovers - How to enable the Prometheus exporter and set up a Grafana dashboard for real-time monitoring
Prerequisites
Before you start, make sure you have:
- [ ] Windows 10 (version 2004+) or Windows 11
- [ ] WSL 2 enabled with Ubuntu 22.04 installed (steps below if you haven’t done this)
- [ ] At least 8 GB RAM on your laptop (4 GB minimum, 8 GB recommended)
- [ ] At least 20 GB free disk space
- [ ] Admin rights on your Windows machine
Lab Environment
| Component | Version / Details |
|---|---|
| Host OS | Windows 10/11 with WSL 2 |
| Linux Distro | Ubuntu 22.04 LTS (WSL) |
| Container Runtime | Docker Desktop (with WSL 2 backend) |
| Kubernetes | Kind v0.27+ (Kubernetes IN Docker) |
| Kubernetes Version | v1.32.x |
| CloudNativePG | v1.25.0 (community open-source) |
| PostgreSQL | 17.2 (community image) |
| kubectl | v1.32+ |
| cnpg plugin | v1.25.0 |
| Helm | v3.16+ |
| Monitoring | Prometheus + Grafana (kube-prometheus-stack) |
Architecture Overview — What We’re Building
Windows 11 Laptop
│
└── WSL 2 (Ubuntu 22.04)
    │
    └── Docker Desktop (WSL backend)
        │
        └── Kind Cluster: "pg"
            │
            ├── Node: pg-control-plane (single node — control + worker)
            │
            ├── Namespace: cnpg-system
            │   └── Pod: cnpg-controller-manager   ← CloudNativePG Operator
            │
            ├── Namespace: default
            │   ├── Pod: cluster-example-1  [PRIMARY]
            │   ├── Pod: cluster-example-2  [REPLICA]
            │   ├── Pod: cluster-example-3  [REPLICA]
            │   ├── Svc: cluster-example-rw  → Primary
            │   ├── Svc: cluster-example-ro  → Replicas
            │   └── Svc: cluster-example-r   → Any
            │
            └── Namespace: monitoring
                ├── Pod: prometheus-server
                └── Pod: grafana
Note: Kind uses a single node for local testing. In production (AWS EKS), you’d have 3 nodes across 3 AZs. The operator behaviour is identical — this local setup is a perfect learning and testing environment.
Part 1: Set Up WSL 2 Ubuntu on Windows
If you already have WSL Ubuntu running, skip to Part 2.
Step 1.1: Enable WSL 2
Open PowerShell as Administrator and run:
wsl --install
This installs WSL 2 and Ubuntu 22.04 by default. Restart your computer when prompted.
After restart, Ubuntu will finish setup — create your Linux username and password when asked.
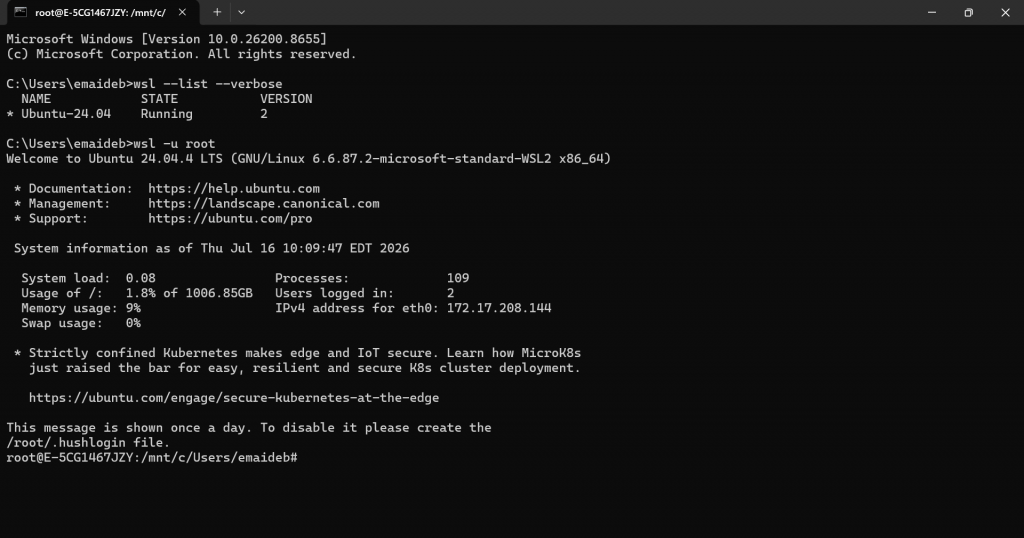
Verify WSL version:
wsl --list --verbose
Expected output:
  NAME            STATE           VERSION
* Ubuntu-22.04    Running         2
Step 1.2: Install Docker Desktop with WSL 2 Backend
- Download Docker Desktop from https://docs.docker.com/desktop/setup/install/windows-install/
- During installation, make sure “Use WSL 2 instead of Hyper-V” is checked
- After installation, open Docker Desktop → Settings → Resources → WSL Integration → Enable for Ubuntu-22.04
Verify Docker is accessible from inside WSL Ubuntu:
# Open Ubuntu terminal and run:
docker --version
docker run hello-world
Expected output:
Docker version 27.x.x, build xxxxx
...
Hello from Docker!
Part 2: Install Kind and kubectl
Open your Ubuntu WSL terminal for all remaining steps.
Step 2.1: Install kubectl
# Download the latest kubectl binary
curl -LO "https://dl.k8s.io/release/$(curl -Ls https://dl.k8s.io/release/stable.txt)/bin/linux/amd64/kubectl"

# Make it executable and move to PATH
chmod +x kubectl
sudo mv kubectl /usr/local/bin/kubectl

# Verify
kubectl version --client
Expected output:
Client Version: v1.32.x
Kustomize Version: vX.X.X
root@E-5CG1467JZY:/mnt/c/Users/emaideb# curl -LO “https://dl.k8s.io/release/$(curl -L -s https://dl.k8s.io/release/stable.txt)/bin/linux/amd64/kubectl”
% Total % Received % Xferd Average Speed Time Time Time Current
Dload Upload Total Spent Left Speed
100 56.7M 100 56.7M 0 0 19.8M 0 0:00:02 0:00:02 –:–:– 19.8M
root@E-5CG1467JZY:/mnt/c/Users/emaideb# chmod +x ./kubectl
root@E-5CG1467JZY:/mnt/c/Users/emaideb# sudo mv ./kubectl /usr/local/bin/kubectl
Step 2.2: Install Kind
# Download Kind binary for Linux amd64
curl -Lo ./kind https://kind.sigs.k8s.io/dl/v0.27.0/kind-linux-amd64

# Make executable and move to PATH
chmod +x kind
sudo mv kind /usr/local/bin/kind

# Verify
kind --version
Expected output:
root@E-5CG1467JZY:/mnt/c/Users/emaideb# [ $(uname -m) = x86_64 ] && curl -Lo ./kind https://kind.sigs.k8s.io/dl/v0.32.0/kind-linux-amd64
  % Total    % Received % Xferd  Average Speed   Time    Time     Time  Current
                                 Dload  Upload   Total   Spent    Left  Speed
100    97  100    97    0     0   1022      0 --:--:-- --:--:-- --:--:--  1031
  0     0    0     0    0     0      0      0 --:--:-- --:--:-- --:--:--     0
100 10.0M  100 10.0M    0     0  11.3M      0 --:--:-- --:--:-- --:--:-- 16.1M
root@E-5CG1467JZY:/mnt/c/Users/emaideb# chmod +x ./kind
sudo mv ./kind /usr/local/bin/kind
root@E-5CG1467JZY:/mnt/c/Users/emaideb# kind --version
kind version 0.32.0
Step 2.3: Install Helm
# Download and run the Helm install script
curl https://raw.githubusercontent.com/helm/helm/main/scripts/get-helm-3 | bash

# Verify
helm version
Expected output:
root@E-5CG1467JZY:/mnt/c/Users/emaideb# curl https://raw.githubusercontent.com/helm/helm/main/scripts/get-helm-3 | bash
  % Total    % Received % Xferd  Average Speed   Time    Time     Time  Current
                                 Dload  Upload   Total   Spent    Left  Speed
100 11929  100 11929    0     0  50403      0 --:--:-- --:--:-- --:--:-- 50546
Downloading https://get.helm.sh/helm-v3.21.3-linux-amd64.tar.gz
Verifying checksum... Done.
Preparing to install helm into /usr/local/bin
helm installed into /usr/local/bin/helm
root@E-5CG1467JZY:/mnt/c/Users/emaideb# helm version
version.BuildInfo{Version:"v3.21.3", GitCommit:"1ad6e68924fdf6fb0c7dcef8e9e1dfc0f36eaed6", GitTreeState:"clean", GoVersion:"go1.26.5"}
Part 3: Create Your Kind Kubernetes Cluster
Step 3.1: Create the Cluster
kind create cluster --name pg
Expected output (takes 1–2 minutes):
Creating cluster "pg" ...
 ✓ Ensuring node image (kindest/node:v1.32.2) 🖼
 ✓ Preparing nodes 📦
 ✓ Writing configuration 📜
 ✓ Starting control-plane 🕹️
 ✓ Installing CNI 🔌
 ✓ Installing StorageClass 💾
Set kubectl context to "kind-pg"
You can now use your cluster with:

kubectl cluster-info --context kind-pg
root@E-5CG1467JZY:/mnt/c/Users/emaideb# kind create cluster –name pg
Creating cluster “pg” …
✓ Ensuring node image (kindest/node:v1.36.1) 🖼
✓ Preparing nodes 📦
✓ Writing configuration 📜
✓ Starting control-plane 🕹️
✓ Installing CNI 🔌
✓ Installing StorageClass 💾
Set kubectl context to “kind-pg”
You can now use your cluster with:
kubectl cluster-info –context kind-pg
Step 3.2: Verify the Cluster
# Check nodes
kubectl get nodes
Expected output:
NAME               STATUS   ROLES           AGE   VERSION
pg-control-plane   Ready    control-plane   89s   v1.32.2
# Check all system pods are running
kubectl get pods -A
Expected output:
NAMESPACE            NAME                                         READY   STATUS    RESTARTS   AGE
kube-system          coredns-668d6bf9bc-9slvd                     1/1     Running   0          89s
kube-system          coredns-668d6bf9bc-p6dpd                     1/1     Running   0          89s
kube-system          etcd-pg-control-plane                        1/1     Running   0          95s
kube-system          kindnet-bltsf                                1/1     Running   0          89s
kube-system          kube-apiserver-pg-control-plane              1/1     Running   0          95s
kube-system          kube-controller-manager-pg-control-plane     1/1     Running   0          95s
kube-system          kube-proxy-lbm4l                             1/1     Running   0          89s
kube-system          kube-scheduler-pg-control-plane              1/1     Running   0          95s
local-path-storage   local-path-provisioner-7dc846544d-hsvkv      1/1     Running   0          89s
Note: Kind automatically includes the
local-path-provisionerStorageClass — this is what CloudNativePG will use to provision PVCs for each PostgreSQL instance. No additional storage setup needed for local testing.
root@E-5CG1467JZY:/mnt/c/Users/emaideb# kubectl get nodes
NAME STATUS ROLES AGE VERSION
pg-control-plane Ready control-plane 7m59s v1.36.1
root@E-5CG1467JZY:/mnt/c/Users/emaideb# kubectl get -A pods
NAMESPACE NAME READY STATUS RESTARTS AGE
kube-system coredns-589f44dc88-htt89 1/1 Running 0 8m8s
kube-system coredns-589f44dc88-sn22w 1/1 Running 0 8m8s
kube-system etcd-pg-control-plane 1/1 Running 0 8m14s
kube-system kindnet-np5ps 1/1 Running 0 8m8s
kube-system kube-apiserver-pg-control-plane 1/1 Running 0 8m15s
kube-system kube-controller-manager-pg-control-plane 1/1 Running 0 8m14s
kube-system kube-proxy-pvqlh 1/1 Running 0 8m8s
kube-system kube-scheduler-pg-control-plane 1/1 Running 0 8m14s
local-path-storage local-path-provisioner-855c7b7774-j2nqk 1/1 Running 0 8m8s
Part 4: Install the CloudNativePG Operator
Step 4.1: Apply the Operator Manifest
kubectl apply --server-side -f \
  https://raw.githubusercontent.com/cloudnative-pg/cloudnative-pg/release-1.25/releases/cnpg-1.25.0.yaml
Expected output (many lines):
namespace/cnpg-system serverside-applied
customresourcedefinition.apiextensions.k8s.io/backups.postgresql.cnpg.io serverside-applied
customresourcedefinition.apiextensions.k8s.io/clusters.postgresql.cnpg.io serverside-applied
...
deployment.apps/cnpg-controller-manager serverside-applied
root@E-5CG1467JZY:/mnt/c/Users/emaideb# kubectl apply –server-side -f https://raw.githubusercontent.com/cloudnative-pg/
cloudnative-pg/release-1.25/releases/cnpg-1.25.0.yaml
namespace/cnpg-system serverside-applied
customresourcedefinition.apiextensions.k8s.io/backups.postgresql.cnpg.io serverside-applied
customresourcedefinition.apiextensions.k8s.io/clusterimagecatalogs.postgresql.cnpg.io serverside-applied
customresourcedefinition.apiextensions.k8s.io/clusters.postgresql.cnpg.io serverside-applied
customresourcedefinition.apiextensions.k8s.io/databases.postgresql.cnpg.io serverside-applied
customresourcedefinition.apiextensions.k8s.io/imagecatalogs.postgresql.cnpg.io serverside-applied
customresourcedefinition.apiextensions.k8s.io/poolers.postgresql.cnpg.io serverside-applied
customresourcedefinition.apiextensions.k8s.io/publications.postgresql.cnpg.io serverside-applied
customresourcedefinition.apiextensions.k8s.io/scheduledbackups.postgresql.cnpg.io serverside-applied
customresourcedefinition.apiextensions.k8s.io/subscriptions.postgresql.cnpg.io serverside-applied
serviceaccount/cnpg-manager serverside-applied
clusterrole.rbac.authorization.k8s.io/cnpg-database-editor-role serverside-applied
clusterrole.rbac.authorization.k8s.io/cnpg-database-viewer-role serverside-applied
clusterrole.rbac.authorization.k8s.io/cnpg-manager serverside-applied
clusterrole.rbac.authorization.k8s.io/cnpg-publication-editor-role serverside-applied
clusterrole.rbac.authorization.k8s.io/cnpg-publication-viewer-role serverside-applied
clusterrole.rbac.authorization.k8s.io/cnpg-subscription-editor-role serverside-applied
clusterrole.rbac.authorization.k8s.io/cnpg-subscription-viewer-role serverside-applied
clusterrolebinding.rbac.authorization.k8s.io/cnpg-manager-rolebinding serverside-applied
configmap/cnpg-default-monitoring serverside-applied
service/cnpg-webhook-service serverside-applied
deployment.apps/cnpg-controller-manager serverside-applied
mutatingwebhookconfiguration.admissionregistration.k8s.io/cnpg-mutating-webhook-configuration serverside-applied
validatingwebhookconfiguration.admissionregistration.k8s.io/cnpg-validating-webhook-configuration serverside-applied
root@E-5CG1467JZY:/mnt/c/Users/emaideb# kubectl get deployment -n cnpg-system cnpg-controller-manager
NAME READY UP-TO-DATE AVAILABLE AGE
cnpg-controller-manager 0/1 1 0 16s
root@E-5CG1467JZY:/mnt/c/Users/emaideb# kubectl get deployment -n cnpg-system cnpg-controller-manager
NAME READY UP-TO-DATE AVAILABLE AGE
cnpg-controller-manager 0/1 1 0 21s
root@E-5CG1467JZY:/mnt/c/Users/emaideb# kubectl get deployment -n cnpg-system cnpg-controller-manager
NAME READY UP-TO-DATE AVAILABLE AGE
cnpg-controller-manager 0/1 1 0 22s
root@E-5CG1467JZY:/mnt/c/Users/emaideb# kubectl get deployment -n cnpg-system cnpg-controller-manager
NAME READY UP-TO-DATE AVAILABLE AGE
cnpg-controller-manager 0/1 1 0 29s
root@E-5CG1467JZY:/mnt/c/Users/emaideb# kubectl get deployment -n cnpg-system cnpg-controller-manager
NAME READY UP-TO-DATE AVAILABLE AGE
cnpg-controller-manager 0/1 1 0 31s
root@E-5CG1467JZY:/mnt/c/Users/emaideb# kubectl get deployment -n cnpg-system cnpg-controller-manager
NAME READY UP-TO-DATE AVAILABLE AGE
cnpg-controller-manager 0/1 1 0 41s
root@E-5CG1467JZY:/mnt/c/Users/emaideb# kubectl get deployment -n cnpg-system cnpg-controller-manager
NAME READY UP-TO-DATE AVAILABLE AGE
cnpg-controller-manager 0/1 1 0 43s
root@E-5CG1467JZY:/mnt/c/Users/emaideb# kubectl get deployment -n cnpg-system cnpg-controller-manager
NAME READY UP-TO-DATE AVAILABLE AGE
cnpg-controller-manager 1/1 1 1 62s
root@E-5CG1467JZY:/mnt/c/Users/emaideb# kubectl get deployment -n cnpg-system cnpg-controller-manager
NAME READY UP-TO-DATE AVAILABLE AGE
cnpg-controller-manager 1/1 1 1 63s
Step 4.2: Verify the Operator is Running
kubectl get deployment -n cnpg-system cnpg-controller-manager
Expected output:
NAME                     READY   UP-TO-DATE   AVAILABLE   AGE
cnpg-controller-manager  1/1     1            1           102s
# Also check the pod
kubectl get pods -n cnpg-system
Expected output:
NAME                                       READY   STATUS    RESTARTS   AGE
cnpg-controller-manager-7d9f7b4c9-xk2p7   1/1     Running   0          2m
root@E-5CG1467JZY:/mnt/c/Users/emaideb# kubectl get deployment -n cnpg-system cnpg-controller-manager
NAME READY UP-TO-DATE AVAILABLE AGE
cnpg-controller-manager 1/1 1 1 63s
Step 4.3: Install the cnpg kubectl Plugin
The cnpg plugin extends kubectl with PostgreSQL-specific commands — cluster status, psql access, switchover, reports, and more. On Ubuntu, install it via the Debian package:
# Download the .deb package
wget https://github.com/cloudnative-pg/cloudnative-pg/releases/download/v1.25.0/kubectl-cnpg_1.25.0_linux_x86_64.deb \
  --output-document kube-plugin.deb

# Install
sudo dpkg -i kube-plugin.deb

# Verify
kubectl cnpg --help
Alternative — install via shell script (works on any Linux):
curl -sSfL \
  https://github.com/cloudnative-pg/cloudnative-pg/raw/main/hack/install-cnpg-plugin.sh \
  | sudo sh -s -- -b /usr/local/bin
root@E-5CG1467JZY:/mnt/c/Users/emaideb# curl -sSfL https://github.com/cloudnative-pg/cloudnative-pg/raw/main/hack/install-cnpg-plugin.sh | sudo sh -s — -b /usr/local/bin
cloudnative-pg/cloudnative-pg info checking GitHub for latest tag
cloudnative-pg/cloudnative-pg info found version: 1.30.0 for v1.30.0/linux/x86_64
cloudnative-pg/cloudnative-pg info installed /usr/local/bin/kubectl-cnpg
Part 5: Deploy a PostgreSQL Cluster
Step 5.1: Download the Sample Cluster Manifest
cat cluster-example.yaml
apiVersion: postgresql.cnpg.io/v1
kind: Cluster
metadata:
name: cluster-example
spec:
instances: 3
storage:
size: 1Gi
Output:
apiVersion: postgresql.cnpg.io/v1
kind: Cluster
metadata:
  name: cluster-example
spec:
  instances: 3
  storage:
    size: 1Gi
This simple YAML is all you need. The operator fills in all the defaults — PostgreSQL version, replication setup, services, secrets, and storage provisioning.
Step 5.2: Apply the Cluster Manifest
kubectl apply -f cluster-example.yaml
Expected output:
cluster.postgresql.cnpg.io/cluster-example created
Step 5.3: Watch the Cluster Initialize
kubectl get pods -w
Watch the pods come up one at a time:
NAME                READY   STATUS     RESTARTS   AGE
cluster-example-1   0/1     Init:0/1   0          10s
cluster-example-1   1/1     Running    0          35s   ← Primary ready
cluster-example-2   0/1     Init:0/1   0          40s
cluster-example-2   1/1     Running    0          65s   ← Replica 1 joined
cluster-example-3   0/1     Init:0/1   0          70s
cluster-example-3   1/1     Running    0          95s   ← Replica 2 joined
Press Ctrl+C once all 3 show Running.
root@E-5CG1467JZY:/mnt/c/Users/emaideb# kubectl apply -f cluster-example.yaml
cluster.postgresql.cnpg.io/cluster-example created
root@E-5CG1467JZY:/mnt/c/Users/emaideb# kubectl get pods -o wide
NAME READY STATUS RESTARTS AGE IP NODE NOMINATED NODE READINESS GATES
cluster-example-1 1/1 Running 0 40s 10.244.0.8 pg-control-plane
cluster-example-1-initdb-gddpc 0/1 Completed 0 94s 10.244.0.7 pg-control-plane
cluster-example-2 1/1 Running 0 20s 10.244.0.11 pg-control-plane
cluster-example-2-join-wv6mc 0/1 Completed 0 29s 10.244.0.10 pg-control-plane
cluster-example-3 0/1 Running 0 3s 10.244.0.14 pg-control-plane
cluster-example-3-join-sm5sv 0/1 Completed 0 9s 10.244.0.13 pg-control-plane
Step 5.4: Verify with kubectl get pods -o wide
kubectl get pods -o wide
Expected output:
NAME                READY   STATUS    RESTARTS   AGE     IP            NODE
cluster-example-1   1/1     Running   0          3m22s   10.244.0.8    pg-control-plane
cluster-example-2   1/1     Running   0          2m59s   10.244.0.11   pg-control-plane
cluster-example-3   1/1     Running   0          2m41s   10.244.0.14   pg-control-plane
root@E-5CG1467JZY:/mnt/c/Users/emaideb# kubectl get pods -o wide
NAME READY STATUS RESTARTS AGE IP NODE NOMINATED NODE READINESS GATES
cluster-example-1 1/1 Running 0 47s 10.244.0.8 pg-control-plane
cluster-example-1-initdb-gddpc 0/1 Completed 0 101s 10.244.0.7 pg-control-plane
cluster-example-2 1/1 Running 0 27s 10.244.0.11 pg-control-plane
cluster-example-2-join-wv6mc 0/1 Completed 0 36s 10.244.0.10 pg-control-plane
cluster-example-3 0/1 Running 0 10s 10.244.0.14 pg-control-plane
cluster-example-3-join-sm5sv 0/1 Completed 0 16s 10.244.0.13 pg-control-plane
Step 5.5: Check Services
kubectl get svc
Expected output:
NAME                  TYPE        CLUSTER-IP      EXTERNAL-IP   PORT(S)    AGE
cluster-example-r     ClusterIP   10.96.x.x       <none>        5432/TCP   3m
cluster-example-ro    ClusterIP   10.96.x.x       <none>        5432/TCP   3m
cluster-example-rw    ClusterIP   10.96.x.x       <none>        5432/TCP   3m
kubernetes            ClusterIP   10.96.0.1       <none>        443/TCP    10m
root@E-5CG1467JZY:/mnt/c/Users/emaideb# kubectl get svc
NAME TYPE CLUSTER-IP EXTERNAL-IP PORT(S) AGE
cluster-example-r ClusterIP 10.96.34.217 5432/TCP 20h
cluster-example-ro ClusterIP 10.96.20.211 5432/TCP 20h
cluster-example-rw ClusterIP 10.96.7.20 5432/TCP 20h
kubernetes ClusterIP 10.96.0.1 443/TCP 21h
Part 6: Manage the Cluster with the cnpg Plugin
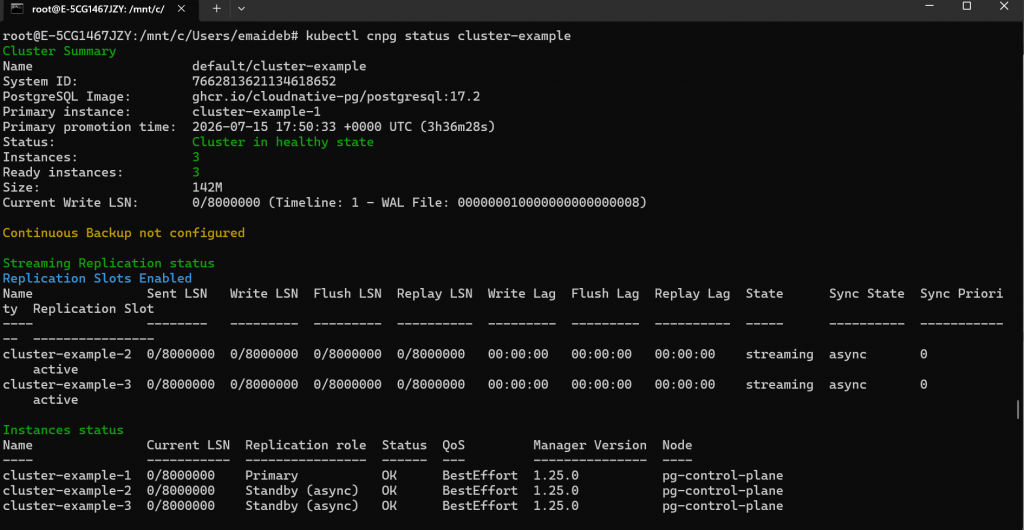
Step 6.1: Full Cluster Status
kubectl cnpg status cluster-example
Expected output:
Cluster Summary
Name:               default/cluster-example
System ID:          7473169624452608026
Postgres Image:     ghcr.io/cloudnative-pg/postgresql:17.2
Primary instance:   cluster-example-1
Primary start time: 2025-02-19 16:35:00 +0000 UTC (uptime 14m7s)
Status:             Cluster in healthy state
Instances:          3
Ready instances:    3
Size:               142M
Current Write LSN:  0/8000000 (Timeline: 1 - WAL File: 000000010000000000000008)
Step 6.2: Connect to the Primary with psql
kubectl cnpg psql cluster-example
This drops you into a psql session directly on the primary:
psql (17.2 (Debian 17.2-1.pgdg110+1))
Type "help" for help.

postgres=# select pg_is_in_recovery();
 pg_is_in_recovery
-------------------
 f
(1 row)
-- f = false = this is the PRIMARY ✅

postgres=# select datname from pg_database;
  datname
-----------
 postgres
 app
 template1
 template0
(4 rows)

postgres=# \q
Step 6.3: Connect to a Replica
kubectl cnpg psql --replica cluster-example
postgres=# select pg_is_in_recovery();
 pg_is_in_recovery
-------------------
 t
(1 row)
-- t = true = this is a REPLICA ✅

postgres=# \q
Step 6.4: Useful cnpg Plugin Commands Reference
| Command | What it does |
|---|---|
kubectl cnpg status cluster-example | Full cluster health overview |
kubectl cnpg psql cluster-example | Interactive psql on primary |
kubectl cnpg psql --replica cluster-example | Interactive psql on a replica |
kubectl cnpg promote cluster-example cluster-example-2 | Promote replica-2 to primary (switchover) |
kubectl cnpg restart cluster-example | Rolling restart of entire cluster |
kubectl cnpg reload cluster-example | Reload PostgreSQL config without restart |
kubectl cnpg maintenance set --all-namespaces | Put all clusters in maintenance mode |
kubectl cnpg maintenance unset --all-namespaces | Remove maintenance mode |
kubectl cnpg report operator -n cnpg-system | Generate debug report ZIP |
Part 7: Enable Prometheus Monitoring and Grafana Dashboard
CloudNativePG ships with a built-in Prometheus metrics exporter on every pod. No extra sidecar containers needed. You just need to install Prometheus and Grafana to consume those metrics.
Step 7.1: Add the Prometheus Community Helm Repo
helm repo add prometheus-community \
  https://prometheus-community.github.io/helm-charts
helm repo update
Step 7.2: Install the Kube-Prometheus Stack
This installs Prometheus, Grafana, and AlertManager in one Helm release, pre-configured with the CloudNativePG sample settings:
helm upgrade --install prometheus-community \
  prometheus-community/kube-prometheus-stack \
  --namespace monitoring \
  --create-namespace \
  -f https://raw.githubusercontent.com/cloudnative-pg/cloudnative-pg/main/docs/src/samples/monitoring/kube-stack-config.yaml \
  --wait
This takes 2–3 minutes. When done:
kubectl get pods -n monitoring
Expected output:
NAME                                                     READY   STATUS    RESTARTS   AGE
alertmanager-prometheus-community-kube-alertmanager-0    2/2     Running   0          2m
prometheus-community-grafana-xxx                         3/3     Running   0          2m
prometheus-community-kube-operator-xxx                   1/1     Running   0          2m
prometheus-community-kube-prometheus-0                   2/2     Running   0          2m
prometheus-community-kube-state-metrics-xxx              1/1     Running   0          2m
kubectl get pods -n monitoring
NAME READY STATUS RESTARTS AGE
alertmanager-prometheus-community-kube-alertmanager-0 2/2 Running 0 5h31m
prometheus-community-grafana-6f944b4bc4-l5bkb 3/3 Running 0 5h32m
prometheus-community-kube-operator-6979b86868-27r45 1/1 Running 0 5h32m
prometheus-community-kube-state-metrics-dc95ccbf8-4vb7b 1/1 Running 0 5h32m
prometheus-prometheus-community-kube-prometheus-0 2/2 Running 0 5h31m
Step 7.3: Deploy a Cluster with Metrics Enabled
The sample cluster-example.yaml doesn’t have monitoring enabled by default. Create a new cluster manifest with a PodMonitor so Prometheus discovers your PostgreSQL pods automatically:
cat <<EOF > cluster-with-metrics.yaml
apiVersion: postgresql.cnpg.io/v1
kind: Cluster
metadata:
  name: cluster-with-metrics
spec:
  instances: 3
  storage:
    size: 1Gi
  monitoring:
    enablePodMonitor: true
---
apiVersion: monitoring.coreos.com/v1
kind: PodMonitor
metadata:
  name: cluster-with-metrics
  labels:
    release: prometheus-community
spec:
  selector:
    matchLabels:
      k8s.enterprisedb.io/cluster: cluster-with-metrics
  podMetricsEndpoints:
  - port: metrics
EOF

kubectl apply -f cluster-with-metrics.yaml
Expected output:
cluster.postgresql.cnpg.io/cluster-with-metrics created
podmonitor.monitoring.coreos.com/cluster-with-metrics created
Step 7.4: Access Prometheus
# Port-forward Prometheus to your local browser
kubectl port-forward svc/prometheus-community-kube-prometheus \
  9090:9090 -n monitoring &
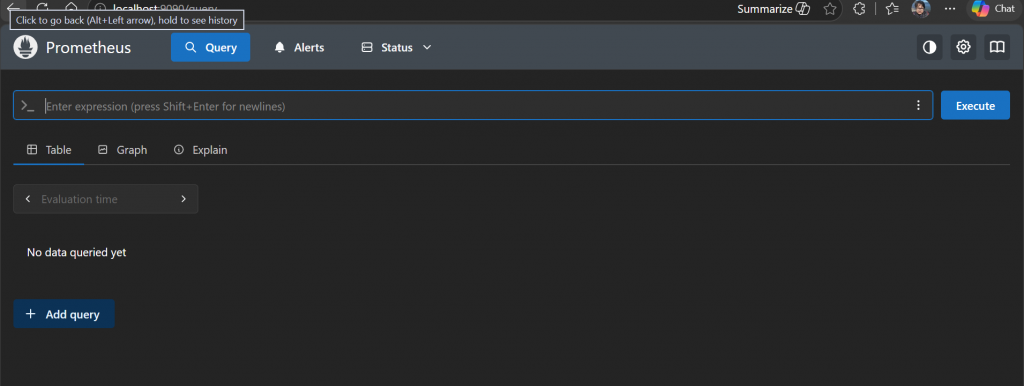
Open your browser (on Windows): http://localhost:9090
In the Prometheus search bar, try:
cnpg_collector_up
You should see metrics from your PostgreSQL pods.
Step 7.5: Access Grafana
# Port-forward Grafana to your local browser
kubectl port-forward svc/prometheus-community-grafana \
  3000:80 -n monitoring &
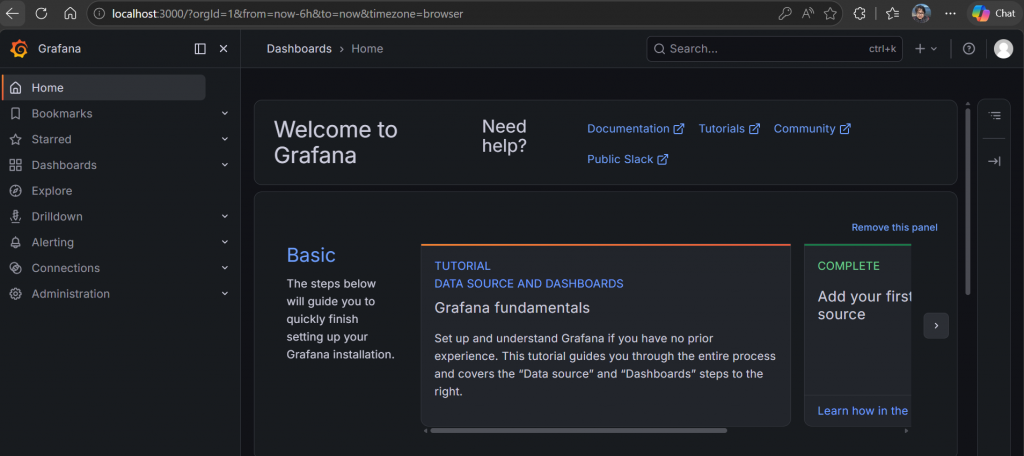
Open your browser (on Windows): http://localhost:3000
Login credentials:
- Username:
admin - Password:
prom-operator
Step 7.6: Import the CloudNativePG Grafana Dashboard
- In Grafana, click Dashboards (left sidebar) → New → Import
- Click “Upload dashboard JSON file”
- Download the dashboard JSON first:
curl -o grafana-dashboard.json \
  https://github.com/cloudnative-pg/grafana-dashboards/blob/main/charts/cluster/grafana-dashboard.json
- Upload the
grafana-dashboard.jsonfile in the Grafana import dialog - Select Prometheus as the data source → Click Import
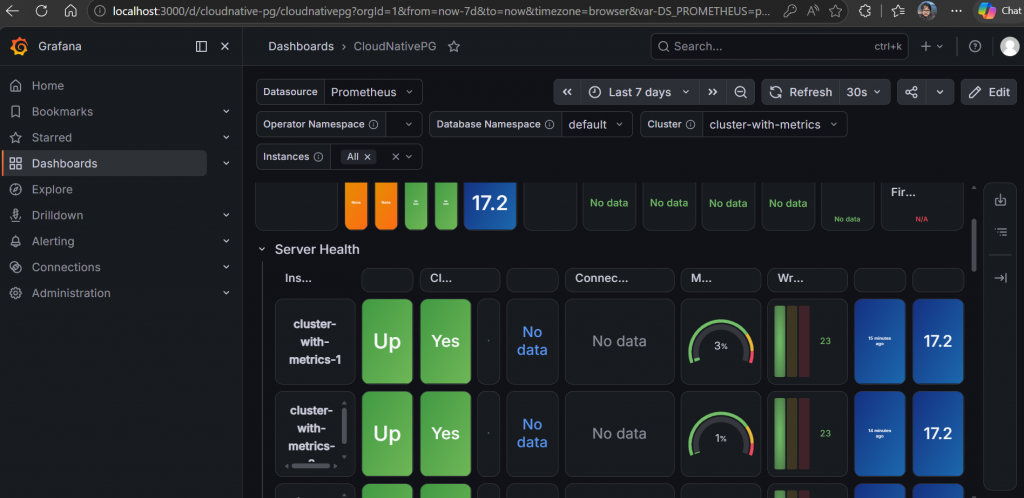
The dashboard shows:
- Cluster status — which instance is primary, how many are healthy
- Replication lag — streaming delay between primary and replicas
- WAL generation rate — write activity on primary
- Storage usage — PVC usage per instance
- Connection counts — active connections per instance
- Postgres uptime — per-instance uptime
Step 7.7: Add Default Prometheus Alert Rules
kubectl apply -f \
  https://raw.githubusercontent.com/cloudnative-pg/cloudnative-pg/main/docs/src/samples/monitoring/prometheusrule.yaml
Verify alerts are registered:
kubectl get prometheusrules
Expected output:
NAME                               AGE
cnpg-default-alerts                30s
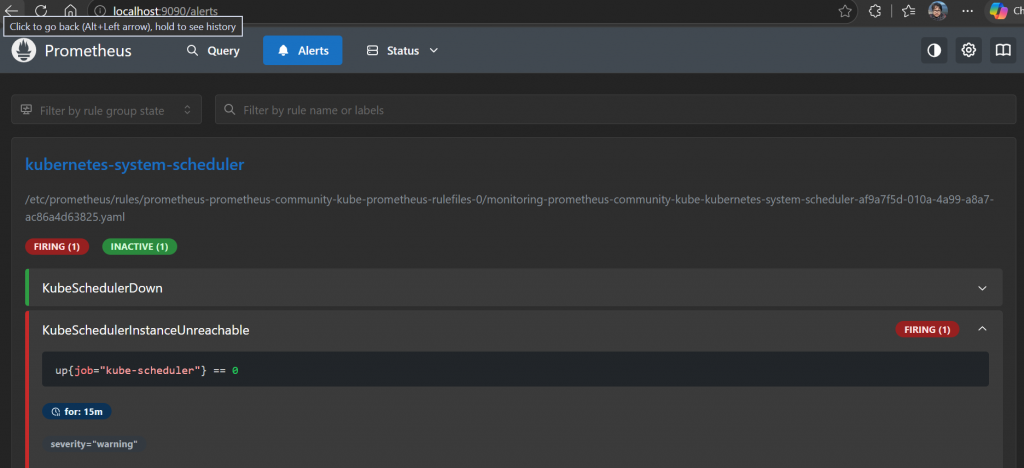
In Prometheus, click Alerts to see the pre-configured rules for things like replication lag, pod failures, and backup failures.
Part 8: What’s Built-In to the CloudNativePG Metrics Exporter
You don’t need to configure anything extra to get metrics. Every CloudNativePG pod exposes these built-in metrics on port metrics:
| Metric Category | Examples |
|---|---|
| Operator level | Operator version, watch namespace, reconcile errors |
| Instance level | pg_up, replication state, WAL position, timeline |
| Database level | Connection counts, transaction rates, lock waits |
| pg_stat_statements | Top queries by execution time (if enabled) |
| Custom metrics | Your own queries via ConfigMap — compatible with postgres_exporter syntax |
All queries run with the pg_monitor role, are read-only, and are transactionally atomic. The exporter also auto-discovers databases — you don’t need to configure per-database scrapers.
Common Errors and Fixes
Error 1: Kind cluster fails to start — “docker daemon not running”
Symptom:
ERROR: failed to create cluster: running kind with rootless provider requires cgroup v2
or
error during connect: Get "http://...": dial tcp ... connection refused
Cause: Docker Desktop is not running, or WSL integration isn’t enabled for Ubuntu.
Fix:
- Open Docker Desktop on Windows → make sure it’s fully started (whale icon in system tray is steady)
- Docker Desktop → Settings → Resources → WSL Integration → toggle Ubuntu-22.04 ON → Apply & Restart
- Reopen Ubuntu terminal and retry
kind create cluster --name pg
Error 2: Pods stuck in Pending — “no nodes available to schedule pods”
Symptom:
kubectl get pods
NAME                READY   STATUS    RESTARTS   AGE
cluster-example-1   0/1     Pending   0          5m
Cause: Usually resource pressure — the Kind node doesn’t have enough memory.
Fix:
# Check events on the stuck pod
kubectl describe pod cluster-example-1 | grep -A 5 Events

# If it says "Insufficient memory", increase Docker Desktop memory:
# Docker Desktop → Settings → Resources → Memory → set to 6GB+
# Then restart Docker Desktop and recreate the cluster
kind delete cluster --name pg
kind create cluster --name pg
Error 3: Port-forward conflicts — “address already in use”
Symptom:
error: unable to listen on port 3000: ... address already in use
Cause: Another process is already using that port (common on WSL when port-forward processes aren’t killed).
Fix:
# Kill all background port-forward processes
pkill -f "kubectl port-forward"

# Retry with a different local port
kubectl port-forward svc/prometheus-community-grafana 3001:80 -n monitoring &
# Then open http://localhost:3001
Error 4: cnpg plugin command not found after install
Symptom:
bash: kubectl-cnpg: command not found
Cause: The plugin binary isn’t in your PATH.
Fix:
# Check where dpkg installed it
which kubectl-cnpg || find / -name kubectl-cnpg 2>/dev/null

# Move to /usr/local/bin
sudo mv $(find /usr -name kubectl-cnpg 2>/dev/null | head -1) /usr/local/bin/kubectl-cnpg

# Verify
kubectl cnpg --help
Key Takeaways
✅ Kind (Kubernetes IN Docker) on WSL Ubuntu is the fastest way to get a real CloudNativePG environment running locally on Windows — no cloud account needed.
✅ A single kubectl apply with a 7-line YAML creates a fully replicated 3-instance PostgreSQL cluster. The operator handles initdb, replication setup, secrets, and services automatically.
✅ The cnpg kubectl plugin gives you direct psql access, cluster health status, switchover commands, and diagnostic reports — all from your terminal without exposing any ports.
✅ CloudNativePG’s built-in Prometheus metrics exporter requires zero extra configuration — just enable monitoring.enablePodMonitor: true in your Cluster spec and point Prometheus at it.
✅ The CloudNativePG Grafana dashboard gives you instant visibility into replication lag, WAL activity, storage usage, and connection counts — critical for both dev and production.
Test Your Knowledge
Ready to test what you’ve learned? Take the free quiz:
👉 PostgreSQL on Kubernetes Quiz → gradeupnow.in/postgres-replication-quiz/
20 questions · Instant feedback · Detailed explanations · Free
What’s Next
This post is part of the PostgreSQL on Kubernetes (CloudNativePG) series:
| # | Post | Status |
|---|---|---|
| 1 | CloudNativePG Architecture on AWS EKS | ✅ Published |
| 2 | Installing CloudNativePG on AWS EKS — Step by Step | ✅ Published |
| 3 | PostgreSQL on Kind in WSL Ubuntu with Grafana Monitoring | 📍 You are here |
| 4 | PostgreSQL Configuration & Pod Tuning on Kubernetes | ⬜ Coming next week |
| 5 | Bootstrap Methods — initdb, Recovery, pg_basebackup | ⬜ Coming soon |
In Post 4, we go inside the Cluster spec and configure PostgreSQL parameters — shared_buffers, max_connections, WAL settings — all through the declarative YAML spec, plus how to set resource limits and requests for your pods.
👉 [Next Post: PostgreSQL Configuration & Pod Tuning on Kubernetes → coming next week]
References
- CloudNativePG Official Documentation v1.25
- Kind Quick Start
- kubectl Install on Linux
- Docker Desktop WSL 2 Backend
- CloudNativePG Monitoring Documentation
- kube-prometheus-stack Helm Chart
- CloudNativePG Grafana Dashboard JSON
- EDB Essentials for CloudNativePG — Student Guide
Found this helpful? Share it with your DBA team! Questions? Drop them in the comments below.