In Post 1, we covered the architecture — the three services, node topology, WAL replication, and how CloudNativePG thinks about PostgreSQL. Now it’s time to build it.
In this post, we’ll install the CloudNativePG operator on a real AWS EKS cluster and deploy a 3-instance PostgreSQL cluster across three availability zones. Every command has been tested in a real lab. Screenshots are attached after each major step.
By the end, you’ll have a running PostgreSQL HA cluster on Kubernetes — with a primary, two replicas, and all three routing services active.
What you’ll learn:
How to prepare your AWS EKS cluster for CloudNativePG
Two installation methods: YAML manifest vs. Helm
How to deploy your first 3-node PostgreSQL cluster
How to verify the operator, pods, services, and secrets
How to get a superuser connection string and connect with psql
How to set up basic monitoring with Prometheus and Grafana
Prerequisites
Before you start, make sure you have:
[ ] AWS EKS cluster running (Kubernetes 1.28+) with 2 worker nodes across 2 AZs
[ ] kubectl configured and pointing to your EKS cluster (kubectl get nodes works)
[ ] helm v3.x installed on your local machine
[ ] AWS EBS CSI Driver installed on EKS (required for persistent storage)
[ ] An EDB subscription token (free — instructions in Step 1)
[ ] Sufficient IAM permissions to create namespaces, deployments, CRDs, and secrets
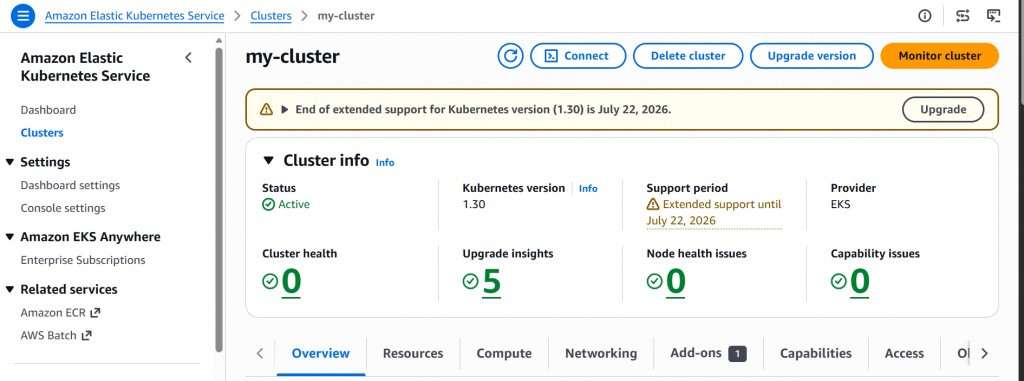
Please create the EKS cluster in AWS from your account. I created using Cloud Shell in CA-CENTRAL-1 region in free account.
curl –silent –location “https://github.com/weaveworks/eksctl/releases/latest/download/eksctl_$(uname -s)_amd64.tar.gz” | tar xz -C /tmp
CloudNativePG v1.28.1 (EDB Postgres AI for CloudNativePG Cluster) requires an EDB subscription token to pull images from the EDB private container registry.
Note: The token is free. You don’t need a paid EDB subscription to use the community PostgreSQL images.
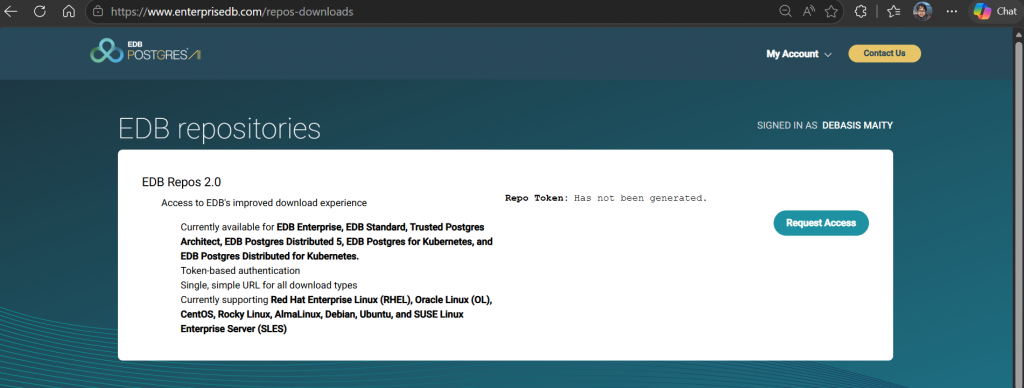
To access EDB repo, please request access using the button below in the screen shot .
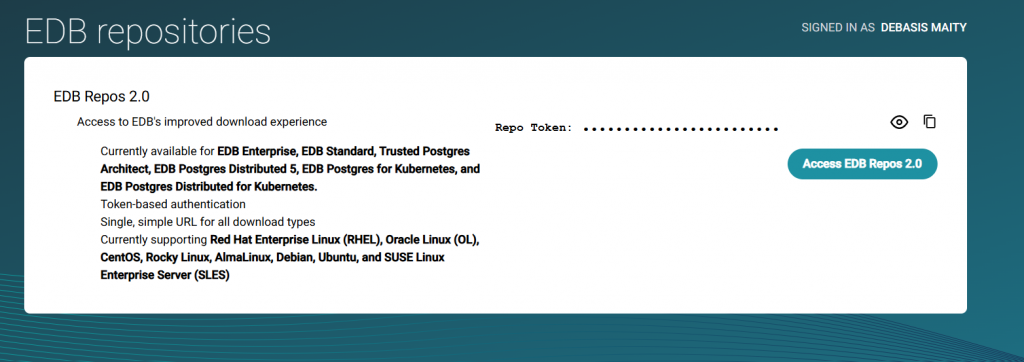
Once logged in, navigate to EDB Repos 2.0 and generate your token.
Copy the token and set it as an environment variable in your terminal:
export EDB_SUBSCRIPTION_TOKEN=<your-token-here>

# Verify it's set
echo $EDB_SUBSCRIPTION_TOKEN
⚠️ Security: Never commit this token to Git or expose it in shell history. Store it in AWS Secrets Manager or a password manager for team use.
Step 2: Prepare the Operator Namespace and Pull Secret
The CloudNativePG operator lives in its own dedicated namespace: postgresql-operator-system. Before installing the operator, you need to create this namespace and add the EDB image pull secret so Kubernetes can pull the operator image from the EDB registry.
# Create the operator namespace
kubectl create namespace postgresql-operator-system

# Verify namespace was created
kubectl get namespace postgresql-operator-system


Expected output:
NAME                          STATUS   AGE
postgresql-operator-system    Active   5s
Now create the image pull secret in that namespace:
kubectl create secret -n postgresql-operator-system docker-registry edb-pull-secret \
  --docker-server=docker.enterprisedb.com \
  --docker-username=<<Username to login to EDB>> \
  --docker-password=$EDB_SUBSCRIPTION_TOKEN
Expected output:
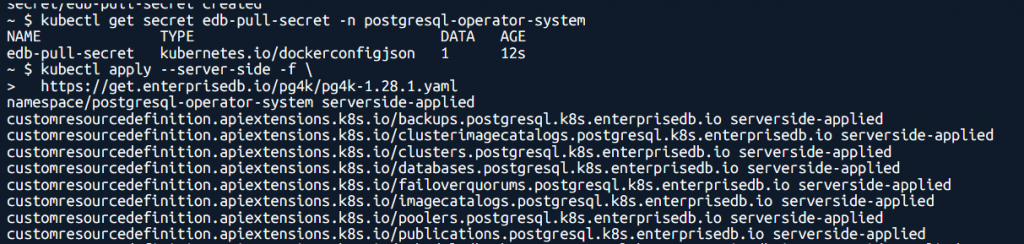
secret/edb-pull-secret created
Verify the secret exists:
kubectl get secret edb-pull-secret -n postgresql-operator-system
Expected output:
NAME              TYPE                             DATA   AGE
edb-pull-secret   kubernetes.io/dockerconfigjson   1      10s
Step 3: Install the CloudNativePG Operator
You have two installation methods. We’ll use both — Method A (YAML manifest) is the simplest for getting started. Method B (Helm) is recommended for production where you need customization.
Method A: Install via YAML Manifest (Simplest)
This installs the operator directly from the official EDB manifest URL:
Release "edb-pg4k" does not exist. Installing it now.
...
STATUS: deployed
REVISION: 1
For this tutorial series, we’ll use Method A (YAML manifest) to keep things explicit. The Helm method is preferred in GitOps workflows where you manage the operator via ArgoCD or Flux.
Step 4: Verify the Operator is Running
After installation, the operator should be running as a single-pod Deployment in the postgresql-operator-system namespace.
# Check the operator deployment
kubectl rollout status deployment \
  -n postgresql-operator-system \
  postgresql-operator-controller-manager
Expected output:
deployment "postgresql-operator-controller-manager" successfully rolled out
# Check the operator pod
kubectl get pods -n postgresql-operator-system
Expected output:
NAME                                                    READY   STATUS    RESTARTS   AGE
postgresql-operator-controller-manager-6d9f7b4c9-xk2p7 1/1     Running   0          2m
# Get more details about the deployment
kubectl get deployments -n postgresql-operator-system
Expected output:
NAME                                     READY   UP-TO-DATE   AVAILABLE   AGE
postgresql-operator-controller-manager   1/1     1            1           2m
[SCREENSHOT: Terminal showing operator pod in Running state] 📸 Screenshot: Operator pod running in postgresql-operator-system namespace
Step 5: Check the Custom Resource Definitions (CRDs)
The operator installs several CRDs that extend Kubernetes. These are the building blocks you’ll use in every future post.
The key one is clusters.postgresql.k8s.enterprisedb.io — this is what you’ll use to define every PostgreSQL cluster going forward.
This is output from cloudshell
~ $ kubectl get configmaps,secrets,serviceaccounts -n postgresql-operator-system NAME DATA AGE configmap/kube-root-ca.crt 1 15h configmap/postgresql-operator-default-monitoring 1 87m
NAME TYPE DATA AGE secret/edb-pull-secret kubernetes.io/dockerconfigjson 1 88m secret/postgresql-operator-ca-secret Opaque 2 87m secret/postgresql-operator-webhook-cert kubernetes.io/tls 2 87m
NAME SECRETS AGE serviceaccount/default 0 15h serviceaccount/postgresql-operator-manager 0 87m ~ $ helm list -A NAME NAMESPACE REVISION UPDATED STATUS CHART APP VERSION ~ $ kubectl get crds | grep -i postgres backups.postgresql.k8s.enterprisedb.io 2026-06-23T17:34:41Z clusterimagecatalogs.postgresql.k8s.enterprisedb.io 2026-06-23T17:34:41Z clusters.postgresql.k8s.enterprisedb.io 2026-06-23T17:34:41Z databases.postgresql.k8s.enterprisedb.io 2026-06-23T17:34:41Z failoverquorums.postgresql.k8s.enterprisedb.io 2026-06-23T17:34:41Z imagecatalogs.postgresql.k8s.enterprisedb.io 2026-06-23T17:34:41Z poolers.postgresql.k8s.enterprisedb.io 2026-06-23T17:34:42Z publications.postgresql.k8s.enterprisedb.io 2026-06-23T17:34:42Z scheduledbackups.postgresql.k8s.enterprisedb.io 2026-06-23T17:34:42Z subscriptions.postgresql.k8s.enterprisedb.io 2026-06-23T17:34:42Z ~ $ kubectl rollout status deployment \
-n postgresql-operator-system \ postgresql-operator-controller-manager deployment “postgresql-operator-controller-manager” successfully rolled out ~ $ kubectl get pods -n postgresql-operator-system NAME READY STATUS RESTARTS AGE postgresql-operator-controller-manager-6c8586857-lmsn5 1/1 Running 1 (90m ago) 91m ~ $ kubectl get deployments -n postgresql-operator-system NAME READY UP-TO-DATE AVAILABLE AGE postgresql-operator-controller-manager 1/1 1 1
Step 6: Create a Namespace for PostgreSQL
Keep your PostgreSQL clusters in a separate namespace from the operator. This makes RBAC, monitoring, and resource management much cleaner.
kubectl create namespace postgres

# Verify
kubectl get namespace postgres
Expected output:
NAME       STATUS   AGE
postgres   Active   3s
Step 7: Deploy Your First PostgreSQL Cluster
Now the fun begins. Create a YAML file that defines a 2-instance PostgreSQL cluster:
Enable OIDC for the cluster (allows Kubernetes to use AWS IAM roles):
cat <<EOF > cluster-example.yaml
apiVersion: postgresql.k8s.enterprisedb.io/v1
kind: Cluster
metadata:
  name: cluster-example
  namespace: postgres
spec:
  instances: 2

  # PostgreSQL version
  imageName: ghcr.io/cloudnative-pg/postgresql:16

  # Storage for each instance's PGDATA
  storage:
    size: 10Gi
    storageClass: gp2  # AWS EKS default StorageClass — use gp3 if configured

  # Spread instances across AZs
  affinity:
    topologyKey: topology.kubernetes.io/zone

  # PostgreSQL configuration overrides
  postgresql:
    parameters:
      max_connections: "200"
      shared_buffers: "256MB"
      log_min_duration_statement: "1000"  # Log queries slower than 1 second
EOF
Apply it:
kubectl apply -f cluster-example.yaml
Expected output:
cluster.postgresql.k8s.enterprisedb.io/cluster-example created
Step 8: Watch the Cluster Come Up
This is the exciting part. Watch the pods initialize one by one:
kubectl get pods -n postgres -w
You’ll see something like this (watch in real time):
NAME                READY   STATUS     RESTARTS   AGE
cluster-example-1   0/1     Init:0/1   0          5s
cluster-example-1   0/1     PodInitializing 0     15s
cluster-example-1   1/1     Running    0          30s    ← Primary is up
cluster-example-2   0/1     Init:0/1   0          35s
cluster-example-2   1/1     Running    0          60s    ← Replica 1 joined
cluster-example-3   0/1     Init:0/1   0          65s
cluster-example-3   1/1     Running    0          90s    ← Replica 2 joined
What’s happening: The operator creates instance 1 first as the primary (via initdb). Instances 2 and 3 join by streaming a base backup from the primary, then start WAL streaming replication. This is all automatic.
Press Ctrl+C to stop watching once all 2 pods are Running.
Step 9: Check the Cluster Status
kubectl get cluster cluster-example -n postgres
Expected output:
NAME              AGE   INSTANCES   READY   STATUS                     PRIMARY
cluster-example   5m    3           3       Cluster in healthy state    cluster-example-1
The STATUS column should say Cluster in healthy state. The PRIMARY column tells you which pod is currently the primary.
# Get more details
kubectl describe cluster cluster-example -n postgres | grep -A 20 "Status:"
~ $ kubectl describe cluster cluster-example -n postgres | grep -A 20 “Status:” Status: Available Architectures: Go Arch: amd64 Hash: 4c1c27c307c90acd68cabe32a88c5b5d20ee75e60d8799b75084d4dcf0d0db5e Go Arch: arm64 Hash: c423938346043d99ad9f86f6046dd4999459deeb10e373f0a13ce733c50bd541 Go Arch: ppc64le Hash: f37ef9e630b280dacba96de332c8aee27975a94c81a5211af9203d30733eb7c1 Go Arch: s390x Hash: 10b61223f5f37a91459ba723b21e5f93a4ff5ca270d3cdcea8490d0a77faaf1b Certificates: Client CA Secret: cluster-example-ca Expirations: Cluster – Example – Ca: 2026-09-21 19:03:35 +0000 UTC Cluster – Example – Replication: 2026-09-21 19:03:35 +0000 UTC Cluster – Example – Server: 2026-09-21 19:03:35 +0000 UTC Replication TLS Secret: cluster-example-replication Server Alt DNS Names: cluster-example-rw cluster-example-rw.postgres
cluster-example-rw.postgres.svc
Status:                True
Type:                  ConsistentSystemID
Last Transition Time:  2026-06-23T19:35:53Z
Message:               Cluster is Ready
Reason:                ClusterIsReady
Status:                True
Type:                  Ready
Last Transition Time:  2026-06-23T19:34:55Z
Message:               Continuous archiving is working
Reason:                ContinuousArchivingSuccess
Status:                True
Type:                  ContinuousArchiving
Last Transition Time:  2026-06-23T19:35:54Z
Message:               velero addon is disabled
Reason:                Disabled
Status:                False
Type:                  k8s.enterprisedb.io/velero
Last Transition Time:  2026-06-23T19:35:54Z
Message:               external-backup-adapter addon is disabled
Reason:                Disabled
Status:                False
Type:                  k8s.enterprisedb.io/externalBackupAdapter
Last Transition Time:  2026-06-23T19:35:54Z
Message:               external-backup-adapter-cluster addon is disabled
Reason:                Disabled
Status:                False
Type:                  k8s.enterprisedb.io/externalBackupAdapterCluster
Last Transition Time:  2026-06-23T19:35:54Z
Message:               kasten addon is disabled
Reason:                Disabled
Status:                False
Type:                  k8s.enterprisedb.io/kasten
Config Map Resource Version: Metrics: Postgresql – Operator – Default – Monitoring: 233852 Current Primary: cluster-example-1 Current Primary Timestamp: 2026-06-23T19:34:55.638679Z Healthy PVC: cluster-example-1 cluster-example-2 Image: ghcr.io/cloudnative-pg/postgresql:16 Instance Names: cluster-example-1 cluster-example-2 Instances: 2 Instances Reported State: cluster-example-1: Ip: 192.168.82.226 Is Primary: true Time Line ID: 1
cluster-example-2:
Instances Status: Healthy: cluster-example-1 cluster-example-2 Latest Generated Node: 2 License Status: License Status: Not enforced Repository Access: false Valid: false Managed Roles Status: Pg Data Image Info: Image: ghcr.io/cloudnative-pg/postgresql:16 Major Version: 16 Phase: Cluster in healthy state Pooler Integrations: Pg Bouncer Integration: Pvc Count: 2 Read Service: cluster-example-r Ready Instances: 2 Secrets Resource Version: Application Secret Version: 233827 Client Ca Secret Version: 233824 Replication Secret Version: 233826 Server Ca Secret Version: 233824 Server Secret Version: 233825 Switch Replica Cluster Status: System ID: 7654676593876070419 Target Primary: cluster-example-1 Target Primary Timestamp: 2026-06-23T19:08:36.396414Z Timeline ID: 1 Topology: Instances: cluster-example-1: cluster-example-2: Nodes Used: 2 Successfully Extracted: true Write Service: cluster-example-rw Events: Type Reason Age From Message —- —— —- —- ——- Normal CreatingPodDisruptionBudget 41m cloud-native-postgresql Creating PodDisruptionBudget cluster-example-primary Normal CreatingServiceAccount 41m cloud-native-postgresql Creating ServiceAccount Normal CreatingRole 41m cloud-native-postgresql Creating Cluster Role Normal CreatingInstance 41m cloud-native-postgresql Primary instance (initdb) Normal CreatingInstance 15m cloud-native-postgresql Creating instance cluster-example-2 ~ $
Step 10: Verify the Three Services
CloudNativePG automatically created three services when the cluster came up:
kubectl get svc -n postgres
Expected output:
~ $ kubectl get svc -n postgres
NAME                 TYPE        CLUSTER-IP       EXTERNAL-IP   PORT(S)    AGE
cluster-example-r    ClusterIP   10.100.18.171    <none>        5432/TCP   46m
cluster-example-ro   ClusterIP   10.100.11.224    <none>        5432/TCP   46m
cluster-example-rw   ClusterIP   10.100.243.253   <none>        5432/TCP   46m
Service
Routes to
Use for
cluster-example-rw
Primary only
Your app’s main R/W connection
cluster-example-ro
Replicas only
Read-only queries, analytics
cluster-example-r
Any instance
Health checks, any read
Step 11: Check the Secrets
The operator automatically creates two secrets with connection credentials:
kubectl get secrets -n postgres
Expected output:
~ $ kubectl get secrets -n postgres
NAME                          TYPE                             DATA   AGE
cluster-example-app           kubernetes.io/basic-auth         11     7h1m
cluster-example-ca            Opaque                           2      7h1m
cluster-example-pull          kubernetes.io/dockerconfigjson   1      7h1m
cluster-example-replication   kubernetes.io/tls                2      7h1m
cluster-example-server        kubernetes.io/tls                2      7h1m
The two secrets you’ll use most:
# Get the superuser password
kubectl get secret cluster-example-superuser -n postgres \
  -o jsonpath='{.data.password}' | base64 -d
echo

# Get the app user password
kubectl get secret cluster-example-app -n postgres \
  -o jsonpath='{.data.password}' | base64 -d
echo
Best practice: In production, don’t decode secrets in the terminal. Use AWS Secrets Manager or Vault integration. This is fine for lab use.
[SCREENSHOT: kubectl get secrets -n postgres output] 📸 Screenshot: Operator-managed secrets — superuser and app credentials
Step 12: Connect to PostgreSQL
Let’s connect to the primary and verify everything is working:
# Port-forward the -rw service to your local machine
kubectl port-forward svc/cluster-example-rw 5432:5432 -n postgres &


# Connect with psql

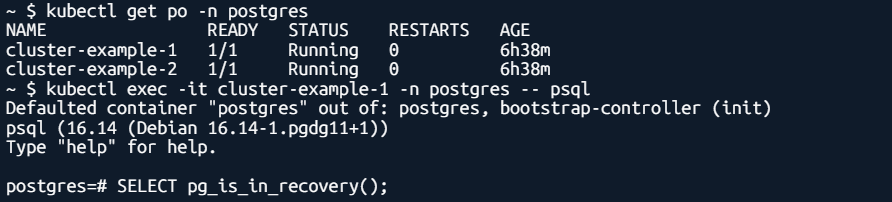
~ $ kubectl get po -n postgres
NAME                READY   STATUS    RESTARTS   AGE
cluster-example-1   1/1     Running   0          6h38m
cluster-example-2   1/1     Running   0          6h38m
~ $ kubectl exec -it cluster-example-1 -n postgres -- psql
Defaulted container "postgres" out of: postgres, bootstrap-controller (init)
psql (16.14 (Debian 16.14-1.pgdg11+1))
Type "help" for help.

postgres=# SELECT pg_is_in_recovery();
 pg_is_in_recovery
-------------------
 f
(1 row)
Once connected, verify replication status:
-- Check which instance you're on
SELECT pg_is_in_recovery();
-- Should return: f  (false = this is the primary)

-- Check replication lag from primary
SELECT application_name, state, sent_lsn, write_lsn, replay_lsn,
       write_lag, flush_lag, replay_lag
FROM pg_stat_replication;
Please note the output executed in cloud shell for the reference
~ $ helm repo add prometheus-community https://prometheus-community.github.io/helm-charts “prometheus-community” has been added to your repositories
~ $ helm repo update Hang tight while we grab the latest from your chart repositories… …Successfully got an update from the “edb” chart repository …Successfully got an update from the “prometheus-community” chart repository Update Complete. ⎈Happy Helming!⎈ ~ $ helm upgrade –install prometheus-community \
prometheus-community/kube-prometheus-stack \ -f https://raw.githubusercontent.com/EnterpriseDB/docs/main/product_docs/docs/postgres_for_kubernetes/1/samples/monitoring/kube-stack-config.yaml Release “prometheus-community” does not exist. Installing it now. NAME: prometheus-community LAST DEPLOYED: Wed Jun 24 02:22:02 2026 NAMESPACE: default STATUS: deployed REVISION: 1 TEST SUITE: None NOTES: kube-prometheus-stack has been installed. Check its status by running: kubectl –namespace default get pods -l “release=prometheus-community”
Visit https://github.com/prometheus-operator/kube-prometheus for instructions on how to create & configure Alertmanager and Prometheus instances using the Operator. ~ $ kubectl apply -f – <<EOF
port: metrics EOF Warning: spec.monitoring.enablePodMonitor is deprecated and will be removed in a future release. Please migrate to manually managing your PodMonitor resources. Set this field to false and create a PodMonitor resource for your cluster as described in the documentation. cluster.postgresql.k8s.enterprisedb.io/cluster-with-metrics created podmonitor.monitoring.coreos.com/cluster-with-metrics created
Patch to expose load balancer for both Grafana and Prometheus
# Open http://10.100.225.199:3000
# Username: admin  |  Password: prom-operator
Import the CloudNativePG Grafana dashboard:
In Grafana → Dashboards → New → Import
Upload the file from: https://raw.githubusercontent.com/EnterpriseDB/docs/main/product_docs/docs/postgres_for_kubernetes/1/samples/monitoring/grafana-dashboard.json
The Enterprise Dashboard Hack
Because you are running the commercial edb-postgres-advanced image, your database outputs metrics starting with cnp_. However, the upstream dashboards search for cnpg_.
Instead of writing a dashboard from scratch, download the open-source one and instantly swap the prefixes using sed:
# Print the JSON to copy it cat edb-dashboard.json
Final Steps in Grafana:
Log into Grafana using your public IP, admin, and the password you extracted.
Go to Dashboards -> Import.
Paste the entire JSON blob from edb-dashboard.json into the “Import via panel json” text box.
Click Load, select your Prometheus data source, and click Import.
Select edb-workload and primary-db from the dropdowns at the top.
Save this to your personal runbook! If you ever need to rebuild this cluster or deploy it to a new region, running these commands top-to-bottom will get your metrics flowing in under 5 minutes.
Common Errors and Fixes
Error 1: ImagePullBackOff on operator pod
Symptom:
NAME                                                    READY   STATUS             RESTARTS
postgresql-operator-controller-manager-xxx              0/1     ImagePullBackOff   0
Cause: The edb-pull-secret is missing or has an incorrect token.
Fix:
# Delete the old secret and recreate it
kubectl delete secret edb-pull-secret -n postgresql-operator-system

kubectl create secret -n postgresql-operator-system docker-registry edb-pull-secret \
  --docker-server=docker.enterprisedb.com \
  --docker-username=k8s \
  --docker-password="$EDB_SUBSCRIPTION_TOKEN"

# Restart the operator pod
kubectl rollout restart deployment \
  postgresql-operator-controller-manager \
  -n postgresql-operator-system
Error 2: Cluster stuck in “Setting up primary instance”
Symptom:
kubectl get cluster cluster-example -n postgres
NAME              STATUS                          PRIMARY
cluster-example   Setting up primary instance
After 5+ minutes, still not progressing.
Cause: Usually a storage issue — the PVC can’t be provisioned. Often the StorageClass doesn’t exist or the EBS CSI driver isn’t installed.
Fix:
# Check PVC status
kubectl get pvc -n postgres

# Check events on the stuck PVC
kubectl describe pvc cluster-example-1 -n postgres | grep -A 10 Events

# Verify your StorageClass exists
kubectl get storageclass

# If using EKS, ensure EBS CSI driver is installed
kubectl get pods -n kube-system | grep ebs
If no StorageClass exists, install the EBS CSI driver via AWS Add-ons in the EKS console, then re-apply your cluster YAML.
Error 3: Webhook error on GKE (not EKS — but documented)
Symptom:
Error: failed to call webhook "vmutate.kb.io": ...connection refused
Cause: On GKE only — firewall blocks traffic to port 9443. Fix: Not applicable for AWS EKS. On EKS, security groups automatically allow inter-node traffic.
Key Takeaways
✅ CloudNativePG requires an EDB pull secret before installation — the token is free and takes 2 minutes to get.
✅ The operator installs in its own postgresql-operator-system namespace and watches all namespaces by default.
✅ A Cluster resource with instances: 3 automatically creates one primary and two streaming replicas — no manual replication setup needed.
✅ Three services (-rw, -ro, -r) are created automatically. Your app should always connect via -rw for read/write and -ro for read-only queries.
✅ Both connection secrets (-superuser, -app) are automatically created and rotated by the operator — never hardcode PostgreSQL passwords.
Test Your Knowledge
Ready to test what you’ve learned? Take the free quiz:
In Post 3, we go deeper into configuration — how to tune postgresql.conf parameters through the Cluster spec, configure resource limits and requests for pods, and set up WAL storage as a separate volume.
👉 [Next Post: PostgreSQL Configuration & Pod Tuning on Kubernetes → coming next week]