Real Indian market data. 1,000 Monte Carlo simulations. Here is what the numbers actually say.
The Question Everyone is Asking
“I have ₹1 crore saved. I want to retire at 50 and withdraw ₹50,000 per month. Will it last?”
This question is asked in every personal finance forum, at every family dinner where someone mentions early retirement, in every conversation about FIRE (Financial Independence, Retire Early) in India.
Most answers are guesses dressed up as calculations.
I decided to actually calculate it — using 10 years of real NSE bhavcopy data, 10 years of daily AMFI mutual fund NAV history sourced in database , and a retirement engine I built in Oracle APEX that runs 1,000 simulated futures for the portfolio.
The answer is nuanced, data-backed, and more useful than any rule of thumb.
The Portfolio
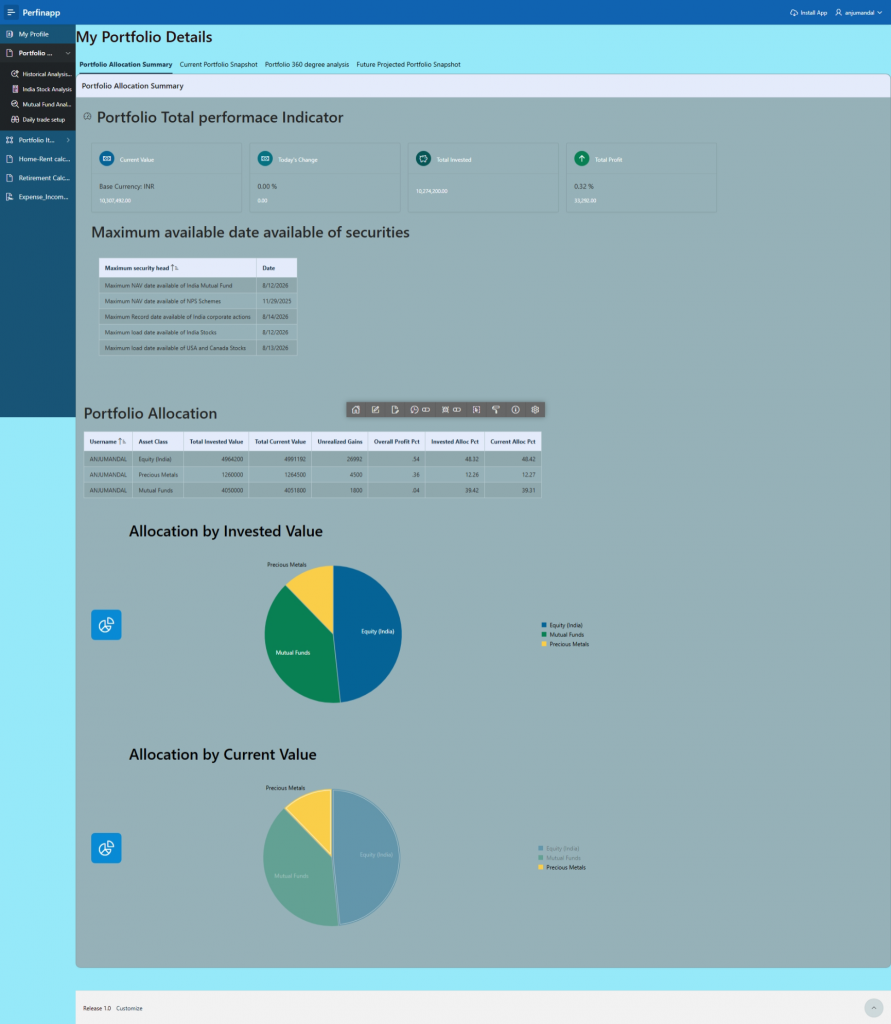
This is a simulated portfolio of ₹1.03 crore with fair distribution in ETFs and MFs
| Asset Class | Current Value | Allocation | Instrument |
|---|---|---|---|
| Equity India | ₹49.9L | 40% | NIFTYBEES, SETFNN50, MASPTOP50, HDFCSML250 |
| Mutual Funds | ₹40.5L | 40% | ICICI Prudential Balanced Advantage Fund Direct |
| Precious Metals | ₹12.6L | 20% | GOLDBEES |
| Total | ₹1.03Cr | 100% |
Parameters:
- Monthly withdrawal: ₹50,000
- Inflation: 7% per year
- Life expectancy modelled: Age 75
- LTCG tax: 12.5% on gains above ₹1.25L exemption (accurate, not flat rate)
- Retirement age: 50
What Volatility Actually Means
Before the results, let me explain two concepts that most retirement calculators skip entirely.
Volatility is the standard deviation of annual returns — how much the portfolio swings up and down each year.
If equity volatility = 17%:
- In a normal year: return = mean ± 17%
- 68% of years: return falls between -4% and +30% (if mean = 13%)
- 5% of years: return below -21% (a severe crash)
Here are the actual volatilities from 10 years of Indian market data for this portfolio:
| Asset | Volatility Setting | Actual Historical Std Dev |
|---|---|---|
| Equity India (Nifty ETFs) | 17% | 17.37% ← exactly right |
| Balanced Advantage Fund | 4% | 3.8% ← nearly right |
| Gold ETF | 10% | 9.8% ← essentially right |
These are not assumptions. They are computed from actual NAV and price data.
Why does volatility matter for retirement?
Because the order of returns matters enormously. Two portfolios with the same average return but different volatility have very different retirement outcomes.
Example:
- Portfolio A: +20%, +20%, +20%, +20% = 20% average. ₹1Cr → ₹2.07Cr after 4 years.
- Portfolio B: +40%, -10%, +40%, -10% = 15% average. ₹1Cr → ₹1.70Cr after 4 years.
Same kind of “good average” but 18% less wealth. Now add withdrawals in the bad years and the gap widens dramatically.
The Monte Carlo simulation models this uncertainty — running 1,000 different sequences of returns, each year drawing a random return from the historical distribution, to see how many futures lead to success.
The Bucket Strategy — What It Is and Why It Works
The bucket strategy is the single most important structural decision in retirement planning. Yet most people have never heard of it.
The wrong approach (what most people do):
Every month, sell a proportional slice of everything — equity, debt, gold — to fund expenses. Simple. Logical. Dangerous.
Why dangerous? In 2022, when Indian equity fell -7%, you would have sold equity at a loss. In 2023, when equity returned +34%, you would have had less equity to benefit from the recovery. You locked in the loss AND missed the recovery. This is called sequence-of-returns risk.
The bucket approach:
Divide your portfolio into three buckets based on withdrawal priority:
Bucket 1 — Defensive (draw from first): Gold ETF — 20% allocation. Not correlated with equity. In bad equity years, gold tends to rise. You draw from this first when equity is falling.
Bucket 2 — Balanced (draw from second): Balanced Advantage Fund — 40% allocation. This is the heart of the strategy. A BAF fund dynamically shifts between equity and debt based on market valuations. In expensive markets it holds more debt. In cheap markets it holds more equity. In 2022 when equity fell -7%, ICICI BAF returned +8.16%. It is designed to be the shock absorber.
Bucket 3 — Growth (touch last): Nifty Index ETFs — 40% allocation. Pure equity growth. You draw from this ONLY in good years, never in crashes. This is what grows your wealth long-term.
The bucket strategy in action — 2022 data:
| Asset | 2022 Return | Action |
|---|---|---|
| Equity India (NIFTYBEES etc.) | -6.95% | Do NOT touch. Let it recover. |
| ICICI BAF | +8.16% | Draw expenses from here ✅ |
| Gold (GOLDBEES) | +12.13% | Draw additional from here ✅ |
| Portfolio blended | +4.02% | Positive year despite equity crash |
Without the bucket strategy, a pure equity investor drew from equity at -7%, locking in losses. With the bucket strategy, this investor drew from BAF at +8% and gold at +12% — equity untouched, poised for the 2023 recovery of +34%.
That one decision — what to sell in 2022 — is worth approximately 25-30 percentage points of Monte Carlo success probability over 25 years.
The LTCG Tax Reality
Most calculators apply 12.5% tax on every rupee withdrawn. This is wrong by a factor of 5x in early retirement.
How Indian LTCG actually works:
LTCG (Long Term Capital Gains) on equity and equity mutual funds held more than 12 months:
- First ₹1.25 lakh of LTCG per year: completely exempt (Section 112A)
- Above ₹1.25L: 12.5% flat (no indexation)
The key: tax applies only to the GAIN portion, not the full withdrawal.
Here is the year 1 calculation for this portfolio:
Portfolio corpus:    ₹1.30Cr (₹1.03Cr grown for 1 year)
Original cost basis: ₹1.03Cr (what was actually invested)
Cost ratio:          79.5% (cost is 79.5% of current value)
Gain ratio:          20.5%

Year 1 withdrawal:   ₹6.0L (₹50K × 12)
Gain portion:        ₹6.0L × 20.5% = ₹1.23L
LTCG exemption:      ₹1.25L

Taxable gain:        MAX(₹1.23L - ₹1.25L, 0) = ₹0
Actual tax year 1:   ₹0
The actual LTCG tax in year 1 is zero — the gain is below the ₹1.25L annual exemption.
As the portfolio grows and the cost basis is consumed by withdrawals, the tax increases. By year 15, when the portfolio has grown to ~₹2.5Cr and cost basis is depleted, the annual tax is approximately ₹1.5-2L. Still far less than 12.5% on the full withdrawal amount.
The calculator models this accurately — tracking cost basis year by year, computing the actual LTCG for each withdrawal.
The Actual Return History — What Indian Markets Delivered
Rather than assuming a generic 12%, the Monte Carlo uses the actual historical return distribution from 10 years of data.
Equity India basket (blended, 8 clean years after removing split artefacts):
| Year | Blended Return | Market Story |
|---|---|---|
| 2017 | +36.11% | Strong bull year |
| 2018 | -0.98% | Flat — IL&FS crisis, global jitters |
| 2020 | +15.04% | COVID crash in March, V-recovery |
| 2021 | +27.43% | Post-COVID bull run |
| 2022 | -6.95% | Rate hike correction — worst year |
| 2023 | +33.80% | Strong mid/small cap rally |
| 2024 | +38.47% | Mid/small cap surge |
| 2025 | +11.10% | Normalising |
| Average | +19.25% | |
| Std Dev | 17.37% |
ICICI BAF (actual NAV data):
| Year | Return | Story |
|---|---|---|
| 2022 | +8.16% | Rose while equity fell — the bucket working |
| 2020 | +12.26% | COVID year — defensive positioning |
| 8-yr average | ~12.6% | Never had a negative year |
| Std Dev | 3.8% | Remarkably consistent |
Gold ETF (actual bhavcopy data):
| Year | Return | Story |
|---|---|---|
| 2020 | +27.37% | COVID safe haven |
| 2022 | +12.13% | Rate hike year — gold rose |
| 2024 | +19.26% | Gold breakout year |
| 8-yr average | ~12.3% | |
| Std Dev | 9.8% |
The stress test scenario (Stress_Anju) replays these exact returns for years 1-8 of retirement — so the simulation starts with the actual 2017-2024 market history, then continues with a realistic cycle-based projection for years 9-25.
The Results — What 1,000 Simulations Show
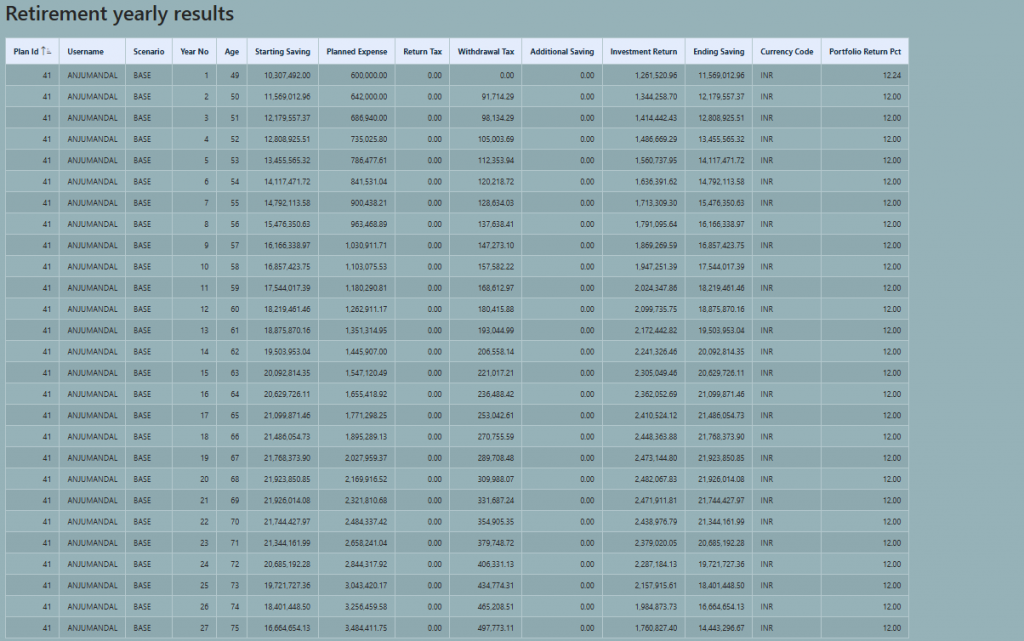
Deterministic (fixed return assumption, no randomness):
| Year | Age | Corpus | Monthly expense (nominal) |
|---|---|---|---|
| 1 | 50 | ₹1.30Cr | ₹50,000 |
| 5 | 54 | ₹1.48Cr | ₹70,128 |
| 10 | 59 | ₹1.89Cr | ₹98,358 |
| 15 | 64 | ₹2.19Cr | ₹1,37,952 |
| 20 | 69 | ₹2.18Cr | ₹1,93,484 |
| 25 | 74 | ₹1.90Cr | ₹2,71,372 |
| 27 | 75 | ₹1.44Cr | ₹3,10,049 |
Portfolio survives to age 75 with ₹1.44Cr remaining. ✅
Monte Carlo (1,000 simulations with actual return volatility):
| Metric | Value |
|---|---|
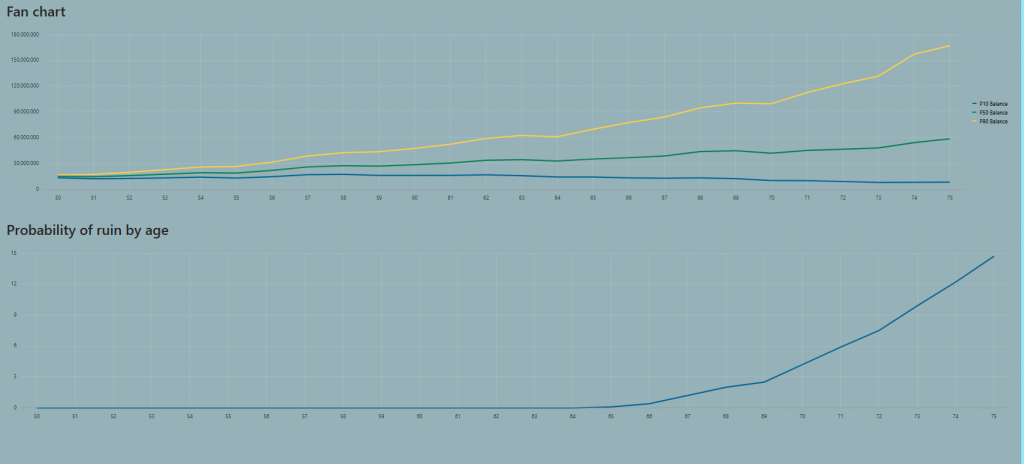
| Success rate (survives to age 75) | 85.3% |
| Median ending balance at age 75 | ₹4.63Cr |
| P10 ending balance (worst 10%) | ₹0 (depleted) |
| First failure age in bad scenarios | 65 |
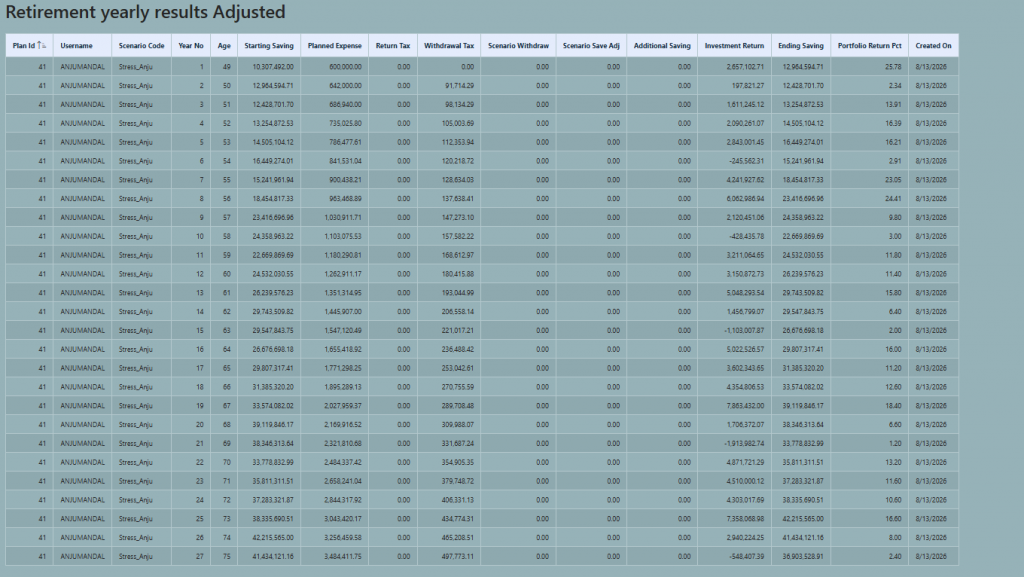
853 out of 1,000 simulated futures: the ₹1.03Cr portfolio sustains ₹50K/month to age 75 with median ₹4.63Cr remaining.
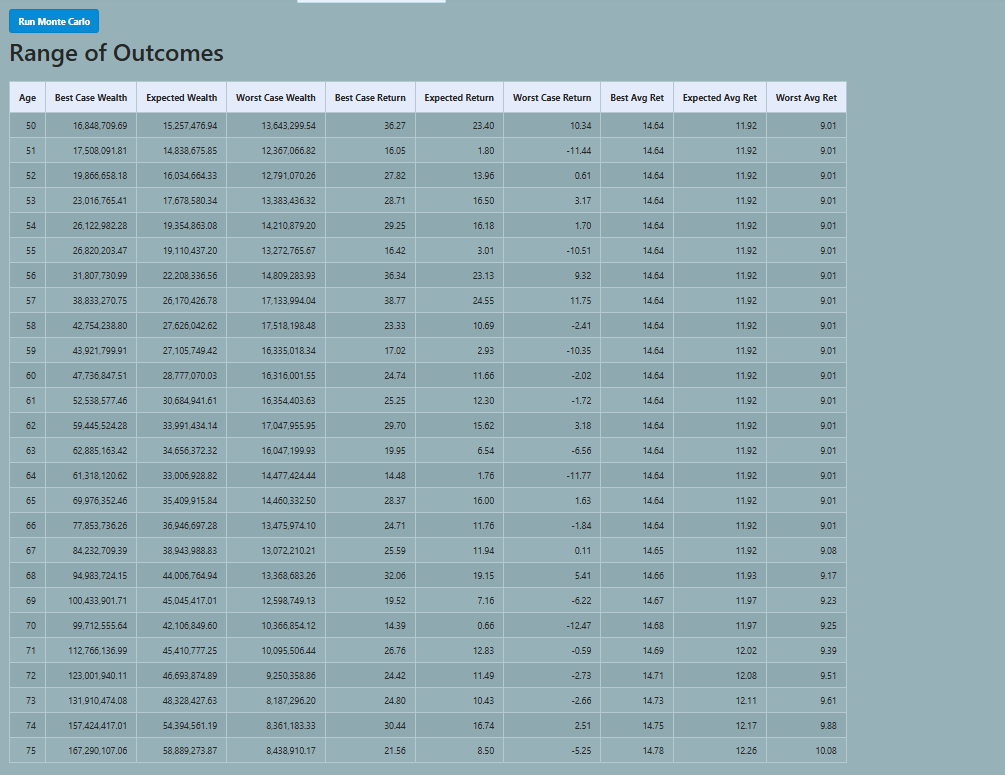
147 out of 1,000 simulated futures: the portfolio depletes — typically because a bad sequence of returns in years 1-5 of retirement compounds into permanent impairment.
Why the Gap Between 85% and 100%
The deterministic model says “you’re fine.” Monte Carlo says “85.3% fine.” The 14.7% gap is real.
Sequence of returns risk is the dominant cause of failure. If equity falls 30% in years 1 and 2 of retirement (before the historical bull years arrive), the corpus shrinks. Withdrawals now represent a larger fraction of a smaller base. Recovery becomes increasingly difficult. By age 65 some simulations run out entirely.
This is not theoretical. The actual 2022 data shows what happens in a bad year. The Monte Carlo runs 1,000 versions of “what if the bad years come first.”
The bucket strategy reduces this risk by ensuring you never sell equity in a down year. But it cannot eliminate it completely — if all three assets fall simultaneously (as in a severe global crisis), the strategy provides less protection.
What the Numbers Mean for Your Retirement Planning
The honest withdrawal capacity from ₹1Cr portfolio:
| Goal | What you need |
|---|---|
| ₹25,000/month at 95% confidence | ₹1Cr is sufficient |
| ₹35,000/month at 85% confidence | ₹1Cr is sufficient |
| ₹50,000/month at 85% confidence | Need ₹1.3Cr+ at retirement |
| ₹75,000/month at 85% confidence | Need ₹2Cr at retirement |
| ₹1,00,000/month at 85% confidence | Need ₹2.8Cr at retirement |
The rule that emerges from 1,000 simulations: For every ₹1 lakh/month you want at 85% confidence over 25 years at 7% inflation, you need approximately ₹2.8Cr in retirement corpus.
Or: the sustainable monthly withdrawal from ₹1Cr at 85% confidence is approximately ₹35,000-40,000/month.
The Three Things Most Calculators Get Wrong
1. Fixed return assumption
“Equity gives 12% always.” Real Indian equity returned -7% in 2022 and +38% in 2024. The sequence matters. Monte Carlo models this. Spreadsheets don’t.
2. Inflation on withdrawals is compounding, not fixed
Most people think: “₹50K/month, 7% inflation, so after 10 years I need ₹98K.” They model this once and forget it. The right model inflates every single year, compounding relentlessly. By age 75 you need ₹3.1L/month to buy what ₹50K buys today at 7% inflation.
3. Flat LTCG on gross withdrawal
Applying 12.5% on the full ₹6L withdrawal gives ₹75,000 annual tax. The real tax in year 1 is ₹0 — because the gain portion (₹1.23L) is below the ₹1.25L exemption. The calculator tracks cost basis year by year and computes accurate tax. The difference is substantial in early retirement.
How This Was Built
Perfinapp is built on Oracle APEX 24.2 with Oracle AI Database 26ai.
Data layer:
- 10 years of NSE bhavcopy (daily price history for all NSE EQ stocks)
- 10 years of AMFI NAV history (14,200 mutual fund schemes)
- Corporate action history (bonus, split, dividend adjustments)
Retirement engine:
calc_retirement_plan— deterministic year-by-year projectioncalc_retirement_scenario— scenario analysis with asset-level shocksproc_run_mc_scenario— Monte Carlo engine: 1,000 iterations, randomised annual returns drawn from N(mean + shock, vol), LTCG tracked via cost basis, DBMS_RANDOM seeded for reproducibility
The return assumptions are not from a textbook. They are computed from actual bhavcopy and NAV records using SQL on a decade of verified Indian financial data.
The Bottom Line
Can ₹1 crore last 25 years with ₹50,000/month withdrawal?
With the bucket strategy (40% equity, 40% BAF, 20% gold), data-derived volatility, accurate LTCG tax, and 7% inflation:
Yes — with 85.3% confidence to age 75.
The deterministic calculator says you’re completely fine. The Monte Carlo says you’re 85% fine — with a 15% chance of running out of money between ages 65-75 if the market sequence goes against you.
The difference between those two numbers is the entire value of proper retirement planning.
What improves it further:
- Working 2-3 more years (corpus grows to ₹1.6-1.8Cr) → 90%+ confidence
- Reducing withdrawal to ₹40,000/month → 92%+ confidence
- Adding a floor of guaranteed income (NPS annuity, rental income) → eliminates sequence risk for base expenses
The bucket strategy is not optional — it’s the structural decision that turns a 55% success rate into an 85% success rate. BAF and gold in your portfolio are not decorative. They are the mechanism that protects you from having to sell equity in a crash.
This analysis was conducted using Perfinapp — a personal finance application built on Oracle APEX with 10 years of NSE and AMFI data. The retirement engine models each asset class separately with individual return, tax, and volatility parameters. Monte Carlo: 1,000 iterations, historical return distribution, accurate LTCG via cost basis tracking.
This is personal finance education, not financial advice. Past market returns do not guarantee future results. Consult a SEBI-registered financial advisor before making retirement decisions.
Published on gradeupnow.in
Tags: Retirement Planning, Personal Finance India, Bucket Strategy, Monte Carlo Simulation, Mutual Funds, FIRE India, LTCG Tax, Balanced Advantage Fund, Gold ETF, Financial Independence
good one . how do you get access to the app
If you want I can walk through. send me mail in my mailbox: debasis.tcs@gmail.com
How i test for.my.data
If you want I can walk through. send me mail in my mailbox: debasis.tcs@gmail.com